Product Overview
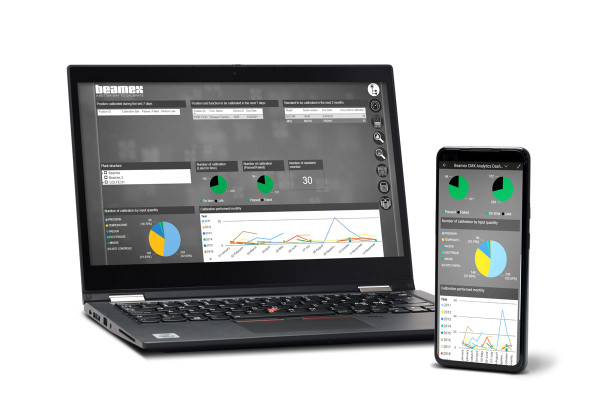
Beamex CMX calibration software helps in planning, managing, analyzing, and documenting all calibration work and assets safely and efficiently. CMX calibration software also has a database with a wealth of useful information – and now this information is readily accessible thanks to our optional CMX reporting dashboard. With the CMX analytics dashboard, you can get a visual overview of CMX data to create reports and more easily analyze trends, helping you to find ways to improve efficiency and save costs.
Scope of supply
- Delivery includes: Power BI file, related documentation.
- Delivery excludes: Power BI training.
- Note: general support is available through the helpdesk.
How it works
The analytics dashboard reports pull info from your CMX database and show it in Microsoft Power BI, an industry-leading tool for visualizing data. The analytics report includes the most commonly needed analytics, enabling users to drill down into the
data contained in the CMX database. The dashboard has several pages (tabs) with information including:
- Calibration KPIs
- Reference standards
- Calibrator traceability
- Work order management
- Scheduling
Key features
Advanced history trend
Enable preventive maintenance based on the output of the dashboard and see the device manufacturer and model maintenance history over time. With history trending based on device manufacturer or model, you can see if a given sensor type performs better or worse than another model.
Scheduling overview
Get an overview of all work done over time to better predict workload during a given month – and act accordingly together with technicians to address any issues.
Calibration history analysis
Get predictions of drift based on a forecast of the last
calibrations performed. If the forecast is good and the trend is
well within out-of-tolerance limits, you can extend the calibration
interval from 6 to 12 months – saving time and money.
Benefits
For supervisors
- Know the workload of the calibration team – helping you to utilize the team more efficiently to bring productivity improvements and cost savings.
- Trace when calibrators have been used and upcoming due dates – which is especially important if a calibrator is found to have been defective or out of tolerance.
- Know which calibrations have been performed and follow up on KPIs.
For technicians
- Know the workload of the team.
- See a complete work history and find if there are ways to
improve performance.
For quality assurance
- Ensure reference standard (calibrator) traceability.
- Ensure calibrations are performed on time – which is specially important if your company does not allow overdue instruments to be used.
To learn more about CMX Analytics Dashboard, please contact us.


